The data you need to understand the 3D printing world and build your 3D printing strategy
Posted By Sculpteo on May 13, 2015 | 0 comments
The first edition of our State of 3D Printing report is live! Discover the results of the largest statistical study on how 3D Printing is improving business with geographical and sectorial insights. A useful tool for whose in charge of defining and executing the 3D printing strategy of their organization.
If you consider yourself as a curious 3D printing user, we’ve got something for you.
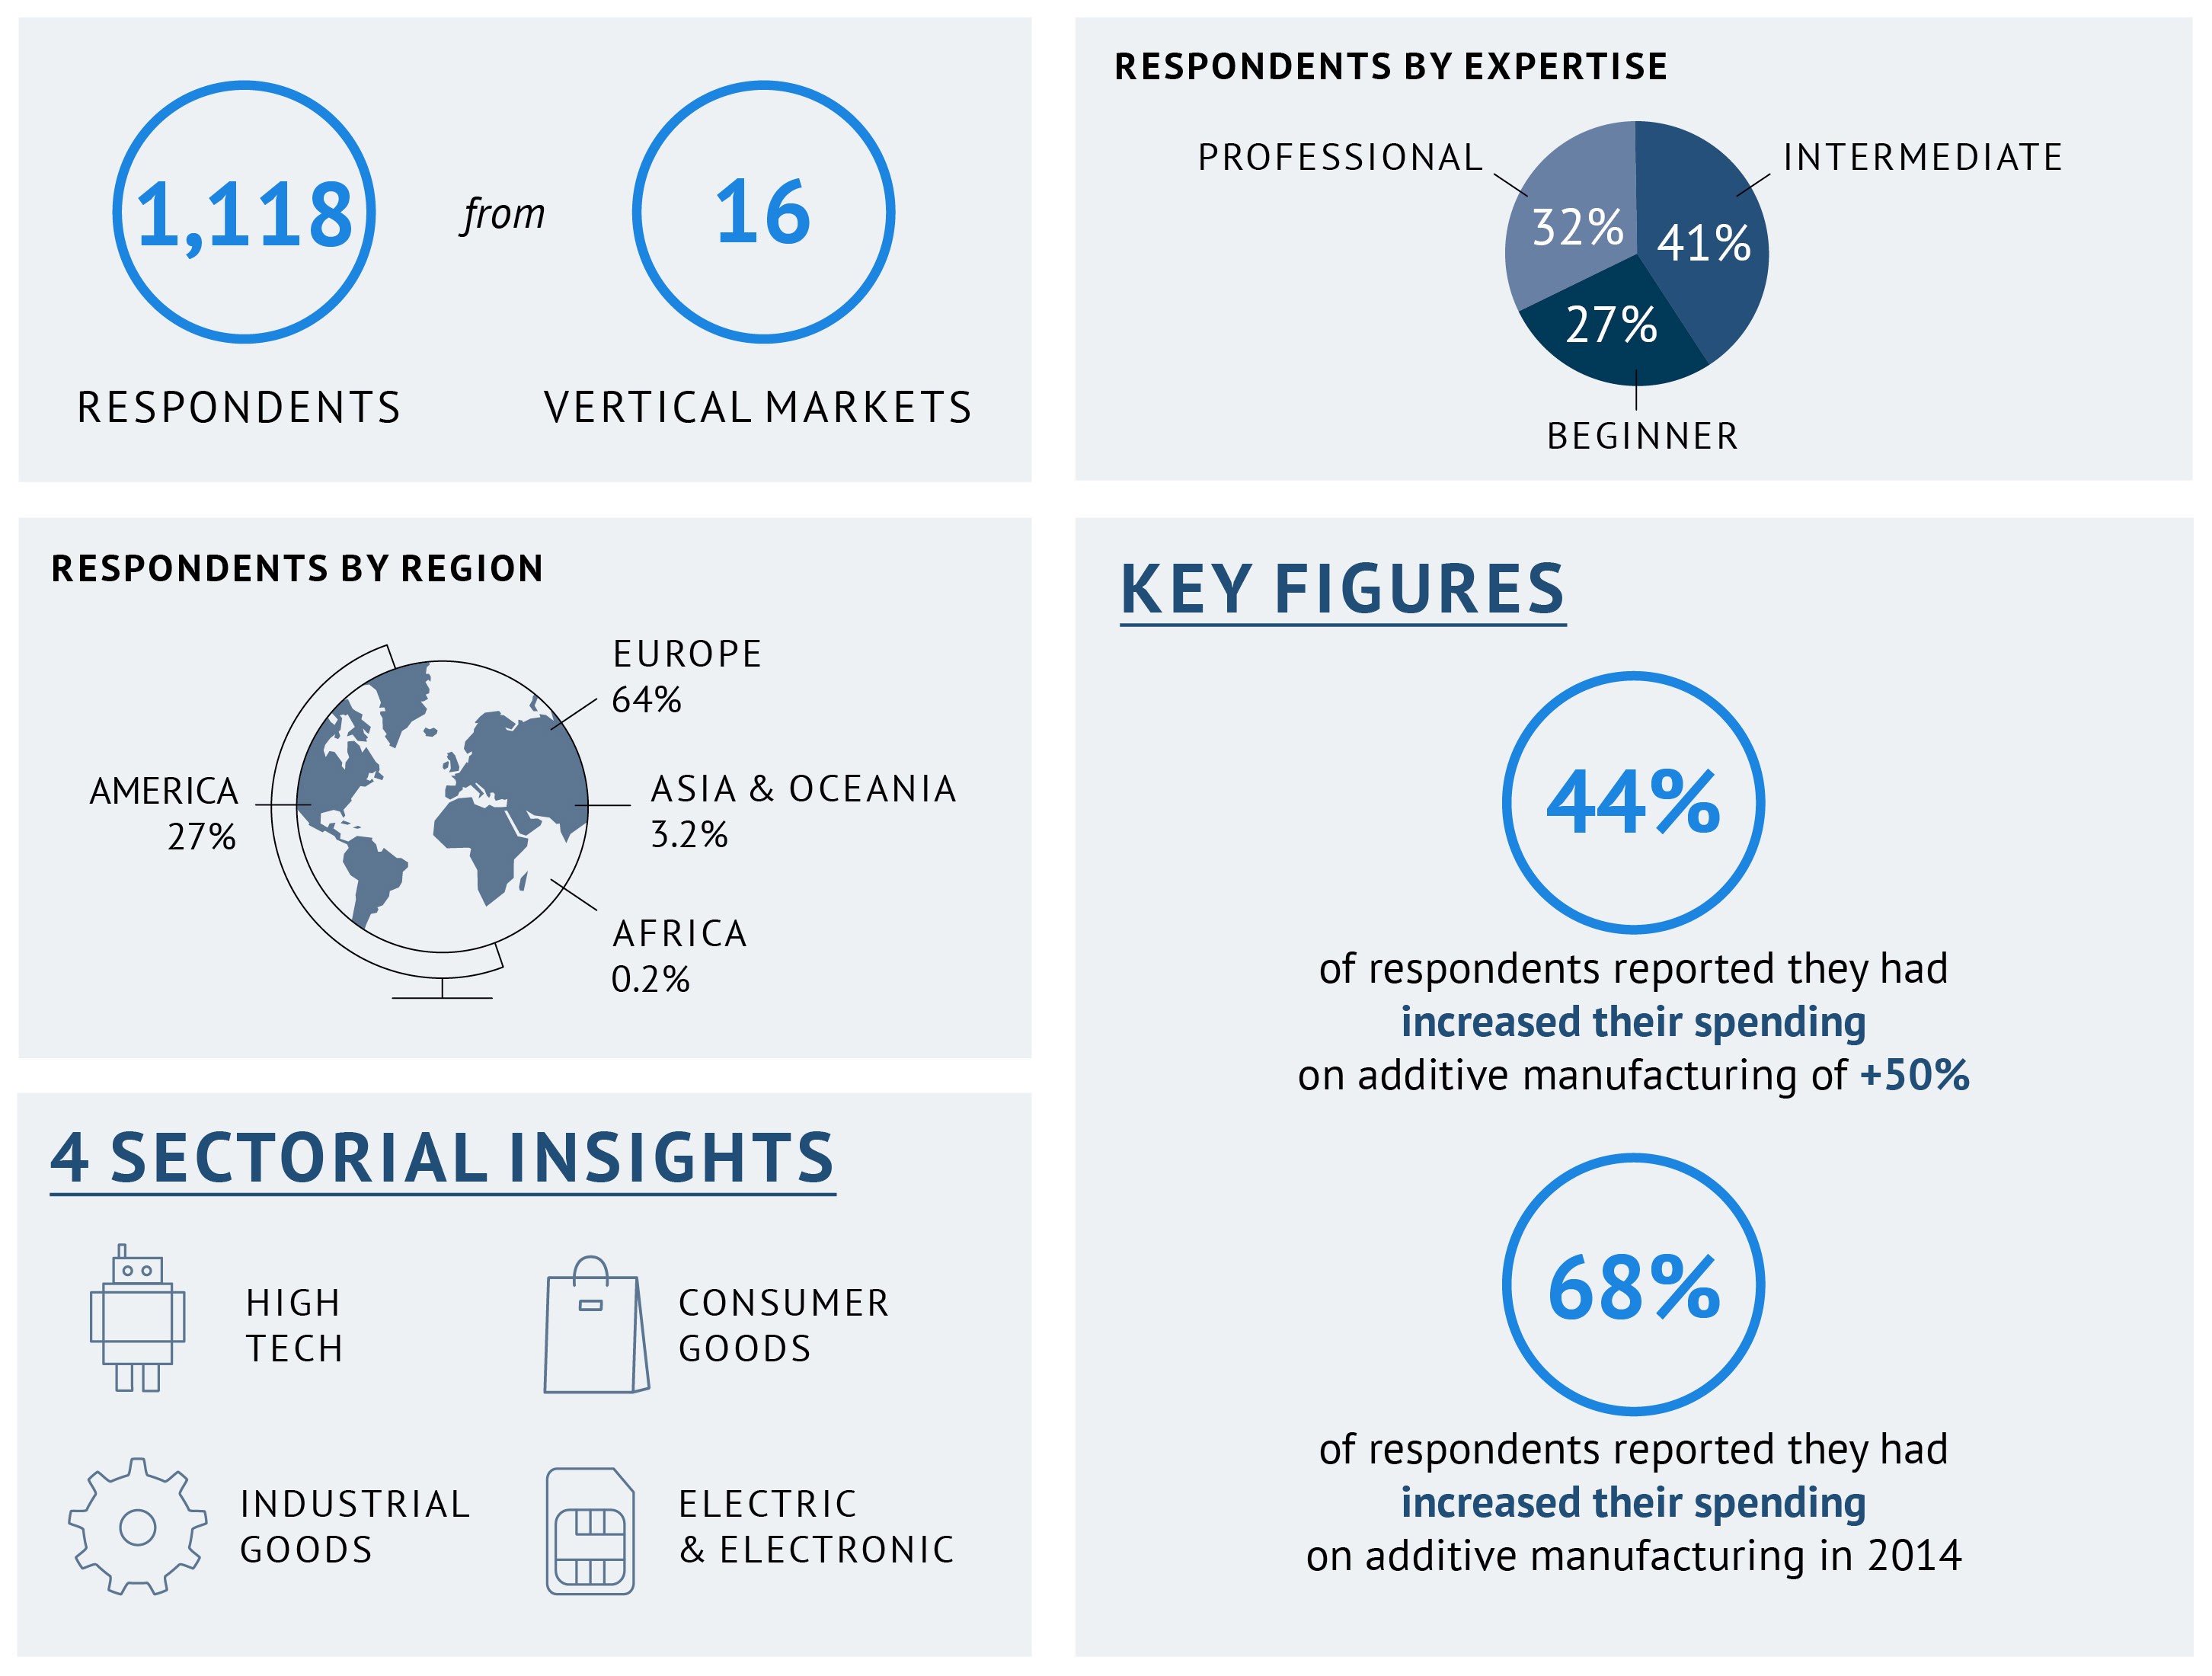
Thanks to our amazing community, we have conducted the largest statistical survey on how 3D printing is changing business. More than 1,100 respondents accross 16 vertical markets and from 50 countries have shared their opinion on how 3D Printing contributes to the performance of their organization and how they implement a 3D printing strategy. The data is summarized in the first edition of our State of 3D Printing report.
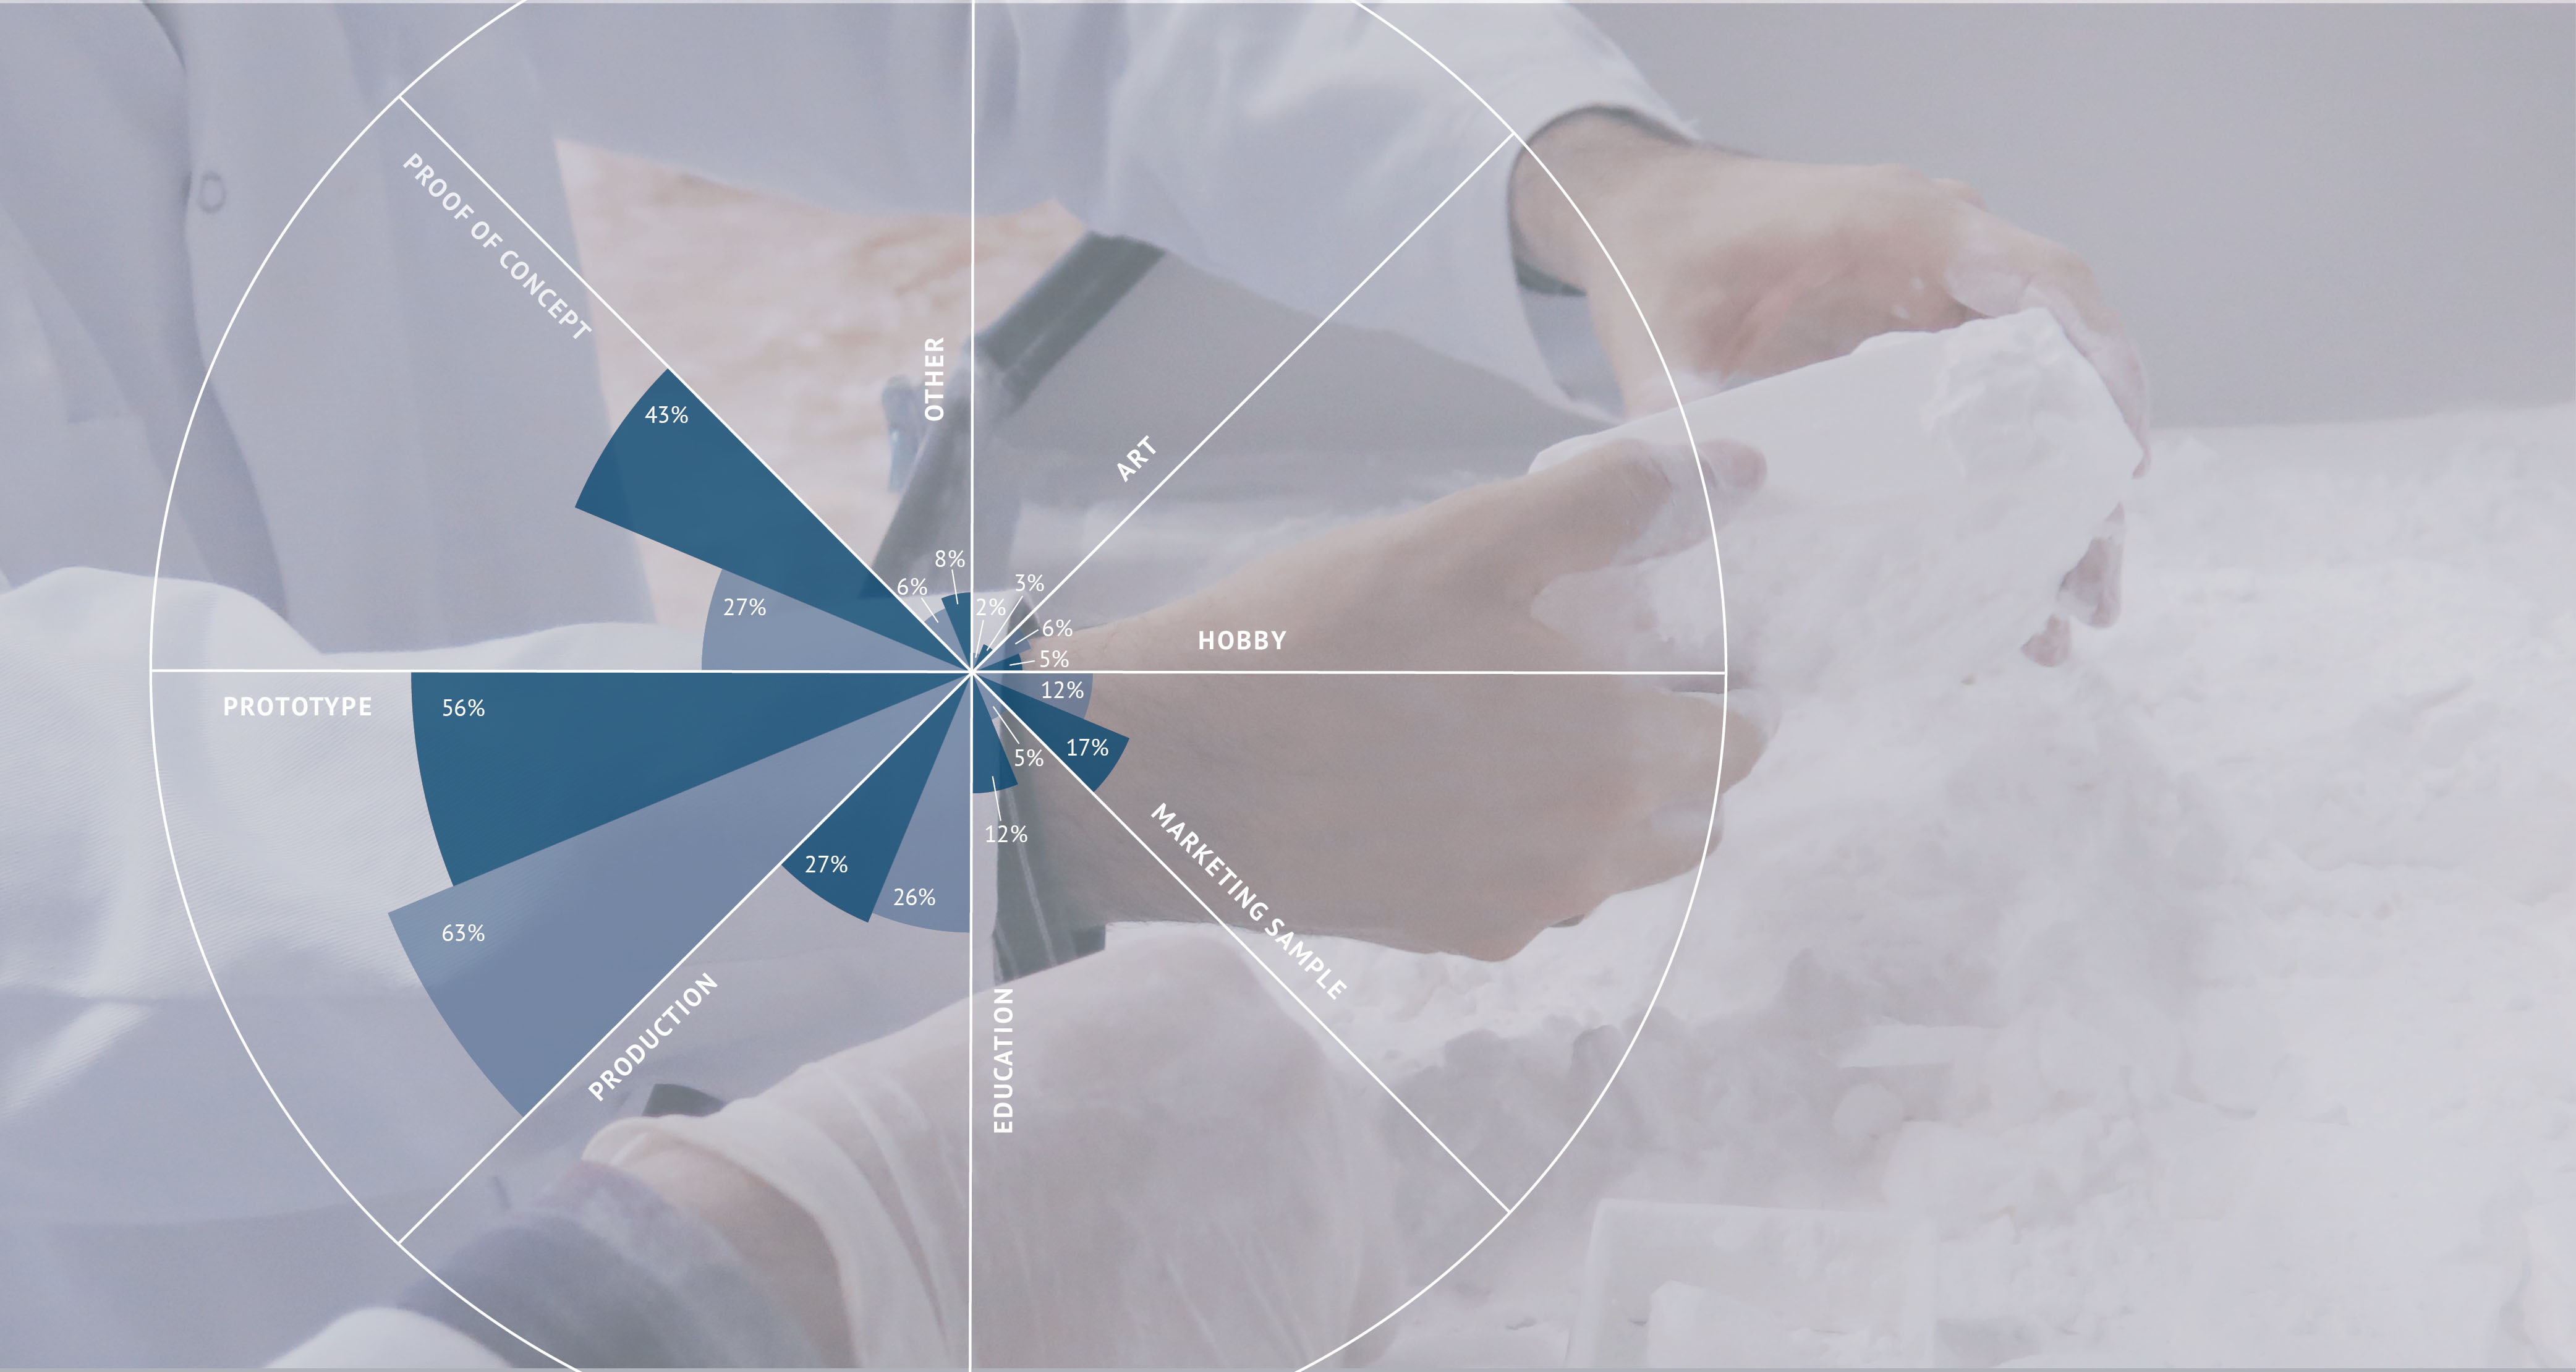
The charts below will give you a basic understanding of the respondents. The complete report gives an highlight on what your peers are up to: who’s practicing 3D printing, what kind of uses they’re focusing, how they’re performing, and how they’re expecting to work with 3D Printing this year.
The State of 3D Printing has 4 main components:
• Trends for 2015 have been gathered from every respondent and comprise the majority of the study
• The geographical insights section compares and contrasts the habits of users on both sides of the Atlantic.
• Executing a 3D printing strategy takes a detailed, practical look at the habits of ‘power users’
• The sectorial insights allows you to compare yourself to others within your industry
The report has already been featured by Louis Columbus in Forbes magazine, focusing on Why 3D Printing Adoption Is Accelerating Globally. Uses and expenses are detailed by sector and by continent in his review. You’ll find also sectorial insights that will help you to benchmark at the end of the barometer.
So download the report, we have no doubt you’re curious about the results.


 Connect with Google
 Connect with Facebook
