State of 3d Printing 2016: first results about our methodology and the sample
Posted By Sculpteo on May 4, 2016 | 0 comments
Sculpteo State of 3D Printing surveyed nearly 1,000 engineers and design professionals at virtually all levels, across all industries, and around the world. We asked what they do, why they do it, how they do it, and if it’s working. The State of 3D Printing report breaks it all down. We will cover the main results in a series of posts. The first one is dedicated to our methodology and the samples.
What is the ROI of 3D Printing?
What is your top 3D Printing priority?
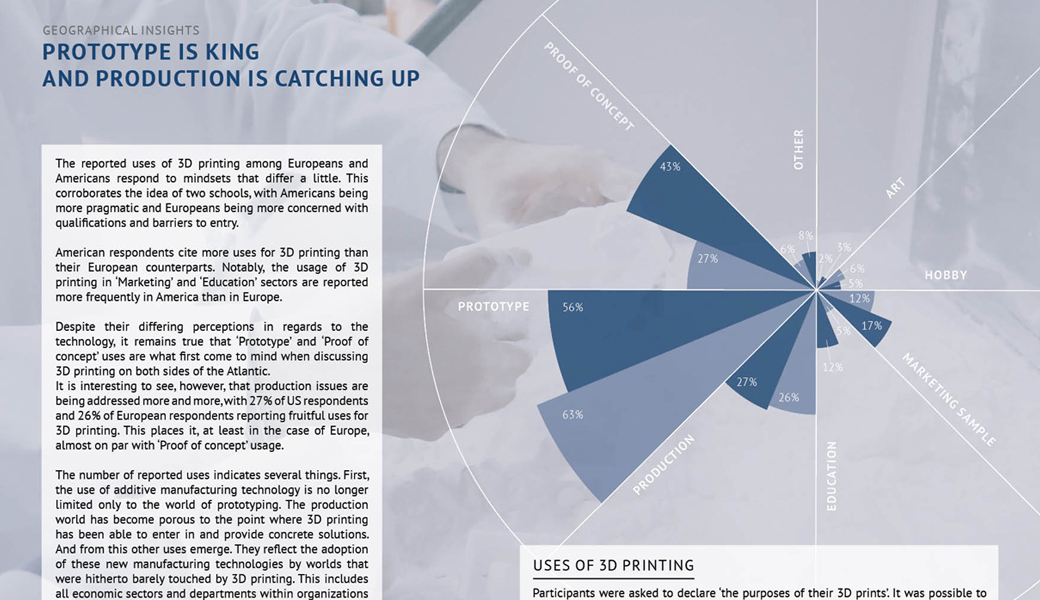
How do you use additive manufacturing?
If you’re interested in getting insights on the 3D printing industry and benchmarking your 3D Printing strategy with other professionals, our State of 3D Printing survey is definitively for you!
The results show actionnable answers for whom wants to take advantage of additive manufacturing in its business. It gives also an overview of the 3D Printing trends for 2016 and for the next 5 years.
Before unveiling the main results of this 2016 edition, we take the time to explain our methodology and share data about our samples in this introduction.
- Our methodology
The online survey has been conducted from January 22nd until March 31st. We got 865 complete results and more than 400 partial results that we have integrated into our analysis.
92% of the questions are exactly the same than last year and enable a fair comparison of the results. We added more categories for the uses and for the materials, based on the comments received last year and on the novelties launched during 2015. We added 5 new questions to understand better how additive manufacturing is helping business to perform and to get more insights about the most used 3D printing technologies (SLA, SLS, FDM etc…).
Our statistical analysis is only based on the collected results. We never modify or amend the answers given by the participants. We haven’t called any of the respondents to ask them to modify, specify or review their answers.
Since 3D Printing is an early-stage industry we still think that it’s hard to put everything is boxes. We wanted to keep the discussion open and get as much feedback as possible from the community. That’s why we set up for each question a ‘Other’-category where people could specify their own use case. Our reports will provide also a semantic analysis of these type of answers.
- More big companies did take the survey this year
Now let’s focus on the typology of the sample.
The profile of the respondents in 2016 has slightly evolved in comparison to 2015. 2/3 of the respondents haven’t taken the survey last year, which shows that the survey attracted new users.
As last year, they are almost all coming from Europe (55%) and America (39%). If we take a broader view, this sample summarizes the behavior of companies and individuals in 53 countries working in 19 different industries.
A wide variety of business and professionals answered to the survey. SMB are the majority of them, as we can conclude when looking at the role of the respondents in their company. For instance, 28% of them are the Owner/CEO and 13% are Freelancers. The main 2 others categories are without surprise Engineers (23%) and Designers (11%).
Significant companies are also represented in the sample, since 22% of the respondents are working in companies of more than $1M/year of revenue, and 8% in companies earning more than $20M/year.
Consumer goods, industrial goods, and High-tech are the most represented industrial sectors this year – a world where people are creating, optimizing and using constantly hardware devices. These 3 sectors represent 46% of the sample.
- The Power-users
Among Sculpteo’s different customers, there are some who are rather advanced users of 3D printing. In the 2015 study, we were surprised to find a uniform group of respondents that make heavy use of 3D printing and exploit its many possibilities. We call them ‘power users’.
As we did last year, we used the same scoring methodology to determine the power-users of 3D Printing in 2016. Thanks to the constructive comments we received last year, we developed our analysis to provide you a good benchmark on what are doing the 3D printing experts. The power-users significantly increased more their business last year than the whole sample (75% against 48%). Something that let us think again that 3D printing is good for improving your business!
This week, we took a deep look into the methodology and the type of respondents of our annual survey The State of 3D Printing. In the next post, we will share with you the most significant trends of the year. Stay tuned!


 Connect with Google
 Connect with Facebook