Create 2D sketches and 3D graphs

As we explained in our introduction, Mathematica is a software that can turn mathematical equations into 2D and 3D graphics. Meaning that you can type any equation and the software will make the calculations and give you as an output its graphical representation. In the following paragraphs we will see how you can get both 2D and 3D sketches out of Mathematica.

Summary​

Every Cell works with inputs and outputs. Input is the equation that the user is giving to the software, and output is the result of the calculations of the program.

To see how this works, let’s create a new Cell at the notebook and select ‘Free form input’.

Screen Shot 2018-04-10 at 10.50.47.jpeg

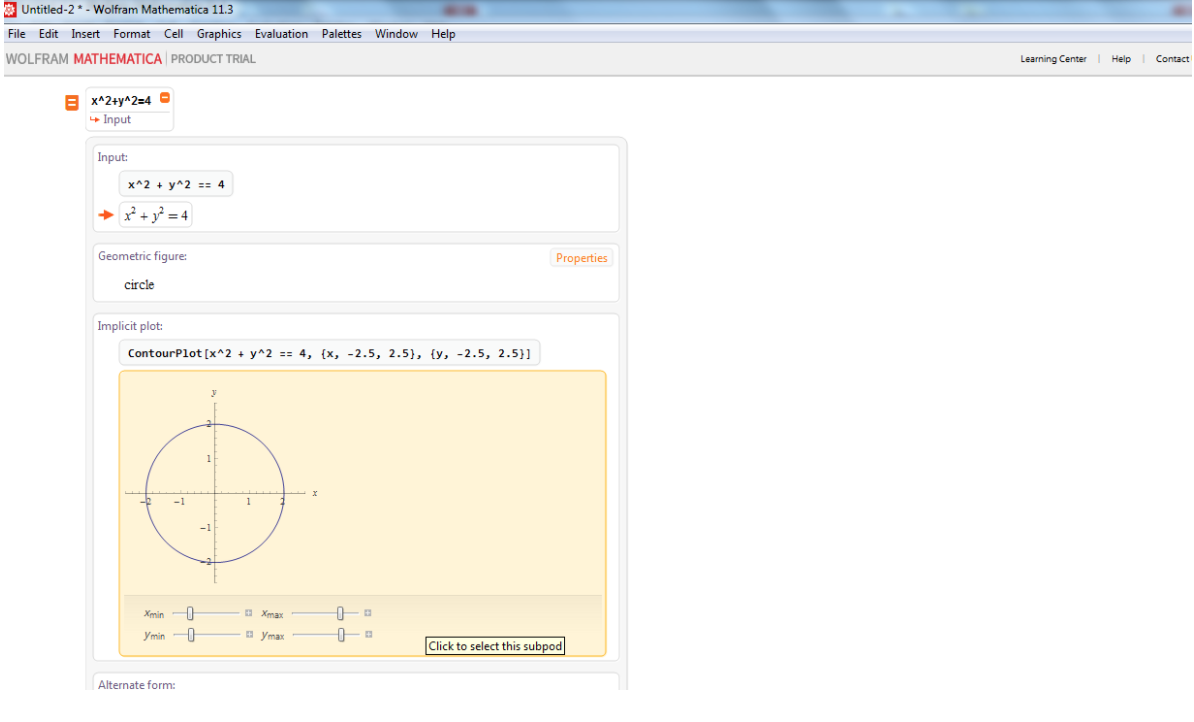
As input, type a mathematical equation. For example, the equation of a circle with radius 2 is: x^2+y^2=2^2. 

Screen Shot 2018-04-10 at 10.50.53.jpeg

Press Enter to get the output of this equation. The output is the graph of the circle that looks like this: 

Screen Shot 2018-04-10 at 10.51.06.jpeg

You can give as input any mathematical equation and Mathematica will turn it into a graph with just a single click! 

If you don’t know or you don’t remember the mathematical equation of a graphic, you can describe it with words. Mathematica can get as input simple descriptions and translate them automatically into graphs.

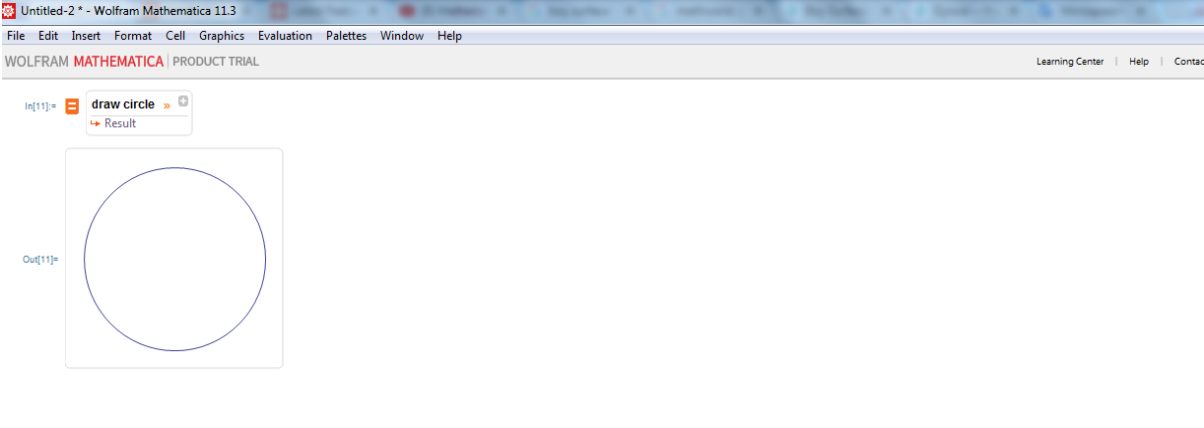
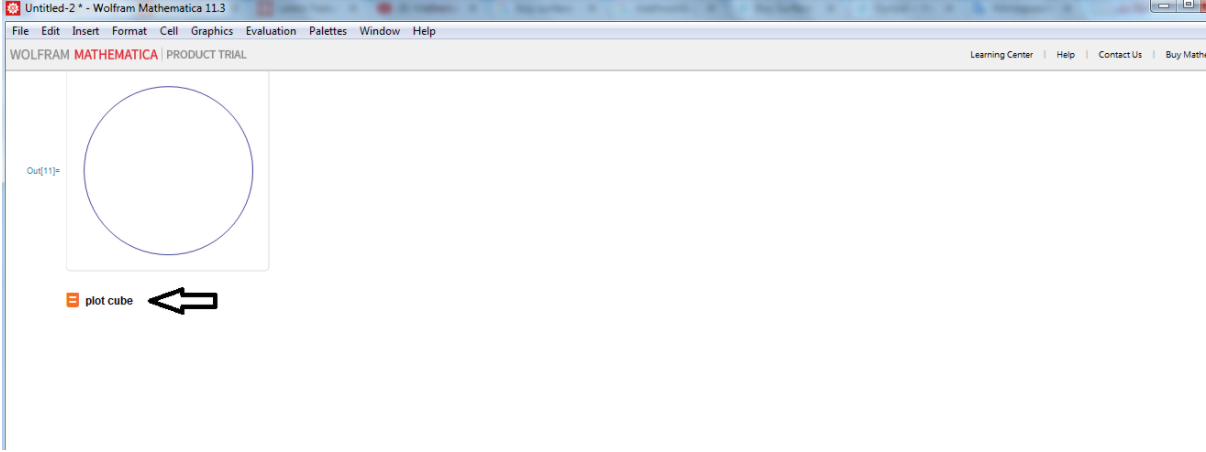
For example, if you want to draw a circle, type ‘draw circle’ and press the down arrow key.

Screen Shot 2018-04-10 at 10.51.16.jpeg

The output you will get is the graph of a circle: 

Screen Shot 2018-04-10 at 10.51.34.jpeg

Now let’s hollow this 3D model and apply a uniform wall thickness to it . We do so because hollowing is a very effective way to reduce the maximum volume of your 3D model, and thus reduce your 3D printing price. We recommend you to do it as much as possible on your 3D parts. For more tips about hollowing, you can check out our blogpost about how to reduce your 3D printing price with hollowing 

Now, let’s undo the “drilling” from the previous steps and bring back the part to its solid form. It should look like this: 

Screen Shot 2018-04-10 at 10.51.44.jpeg

The outcome you will get looks like this: 

Screen Shot 2018-04-10 at 10.52.16.jpeg

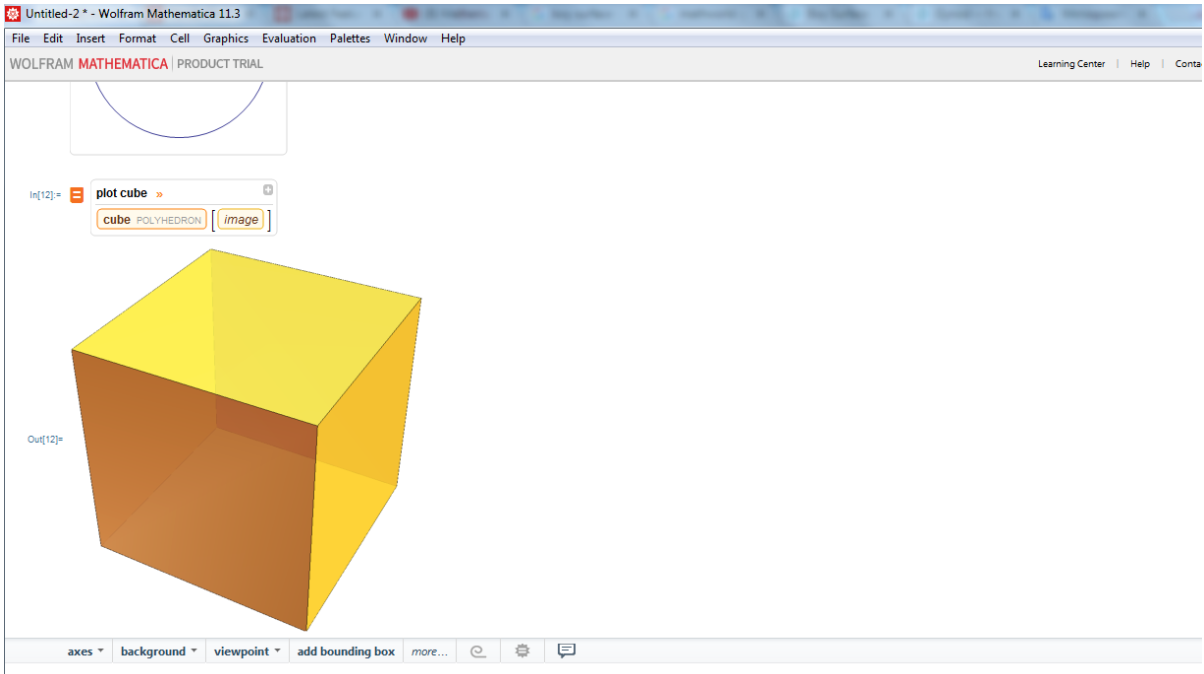
Now, let’s create something more complex. 

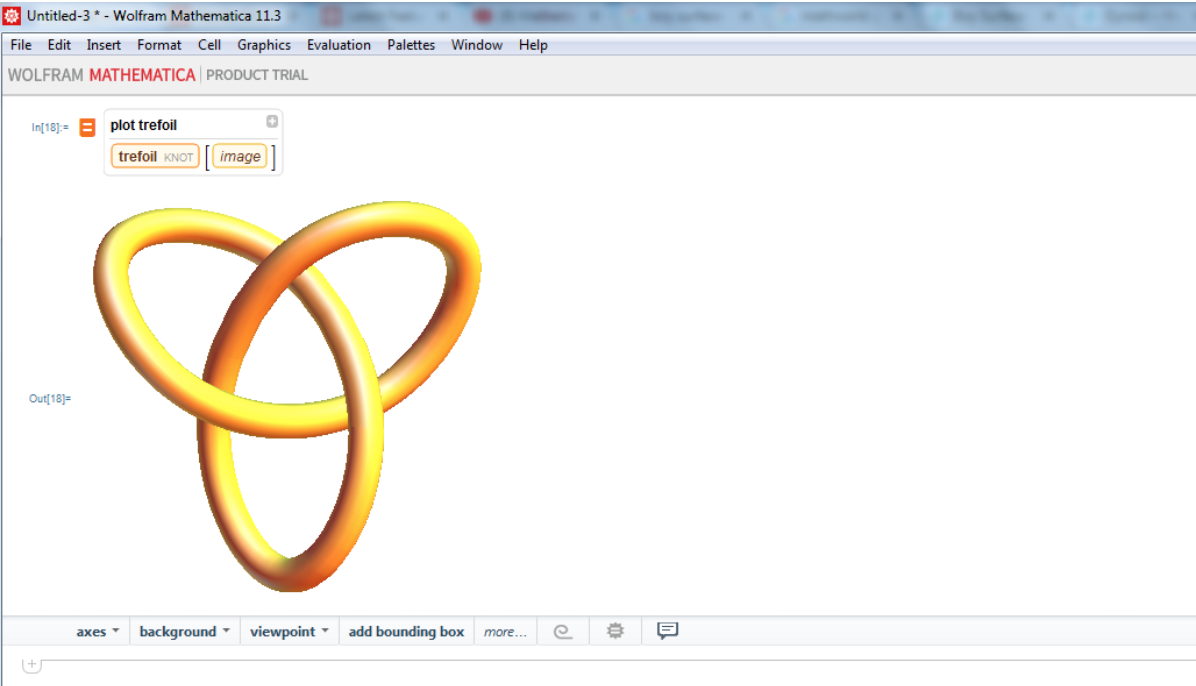
Type ‘plot trefoil’ and press enter.

Screen Shot 2018-04-10 at 10.52.24.jpeg

The result you will get is the 3D shape of a trefoil that looks like this:

Screen Shot 2018-04-10 at 10.52.36.jpeg

The more geometrically complex the graph, the more complex its equation. Of course it is difficult to write by yourself mathematical equations of such complexity, but you can download them. 

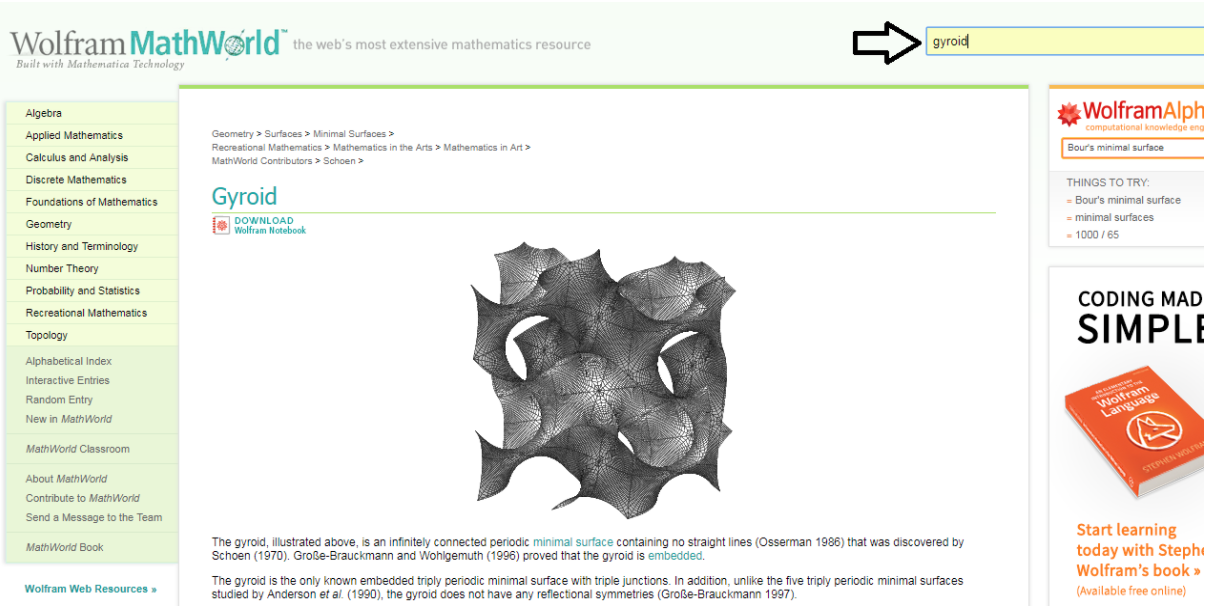
To download complex 3D models go to http://mathworld.wolfram.com/ and type the 3D graph you are looking for. For example, let’s search for the equation of a ‘gyroid’. 

Screen Shot 2018-04-10 at 10.52.50.jpeg

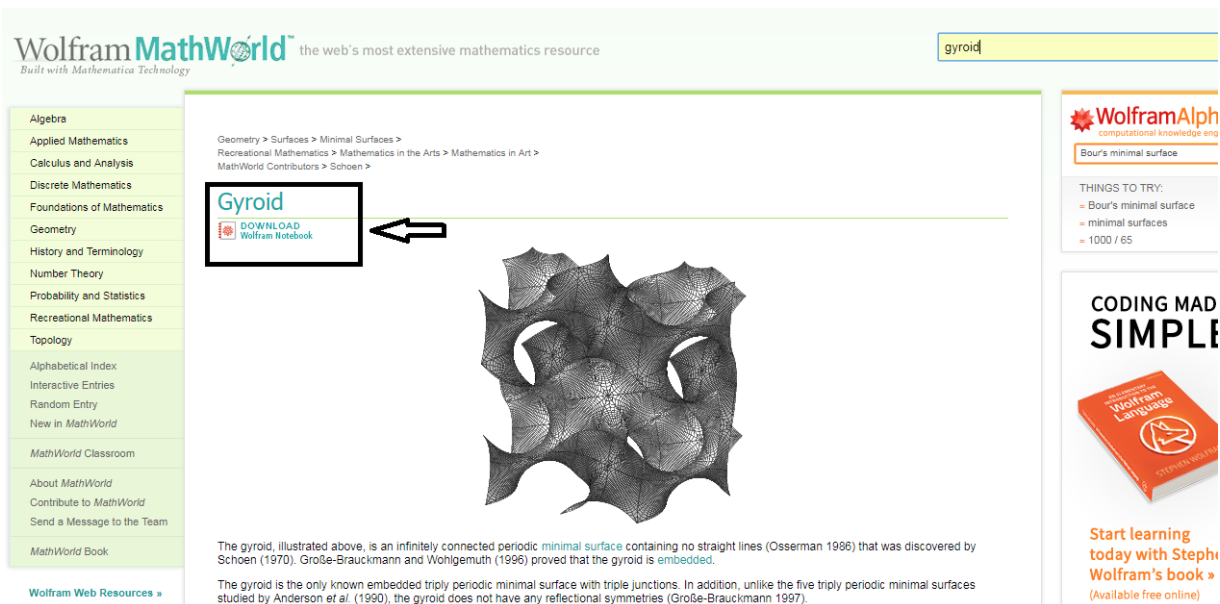
Then, download the ‘Wolfram Notebook’. The notebook contains all the functions that you will need to create your input in Mathematica. 

Screen Shot 2018-04-10 at 10.53.02.jpeg